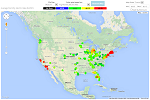
Getting a handle on energy data for a large number of physical locations can be a challenge at best, and a seemingly insurmountable task at worst. The prospect of wading through thousands or millions of data points to assemble a useful piece of information is not something most people get excited about, but around here it’s what we excel at. Creating reports, charts and graphs that answer specific questions about energy is our bread and butter, but sometimes a table doesn’t do enough to fully convey information hidden in the data. One of the ways we augment our toolset is by overlaying location-specific energy data on a geographical map, giving the user a handy way to spot problem areas, regional trends, and location density. For instance, the map below shows average monthly electric rates for a client with a heavy concentration of sites in the eastern U.S., as well as a few spread out in the west:

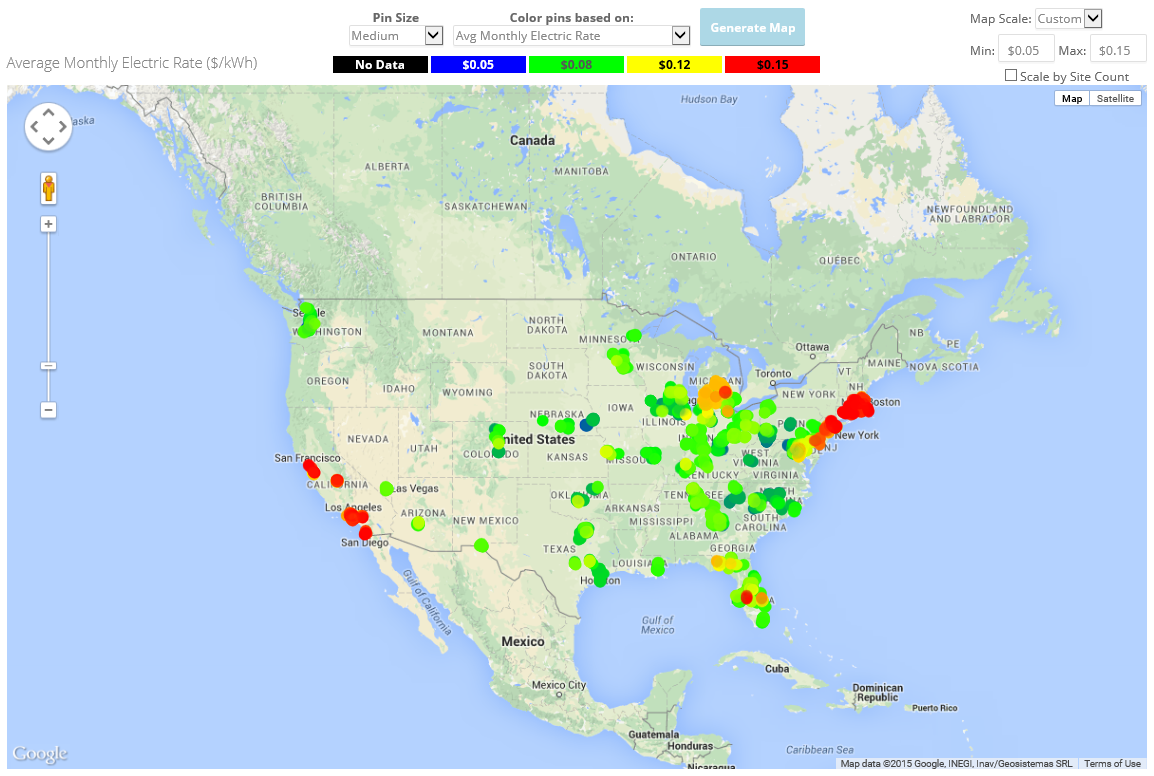
As you would expect, we see higher rates in California and the Northeast. However, just looking at the data this way we can immediately get a sense of how many locations are in high rate markets (or have good supply deals in place) and which are not. Zooming in shows the delineation more clearly:
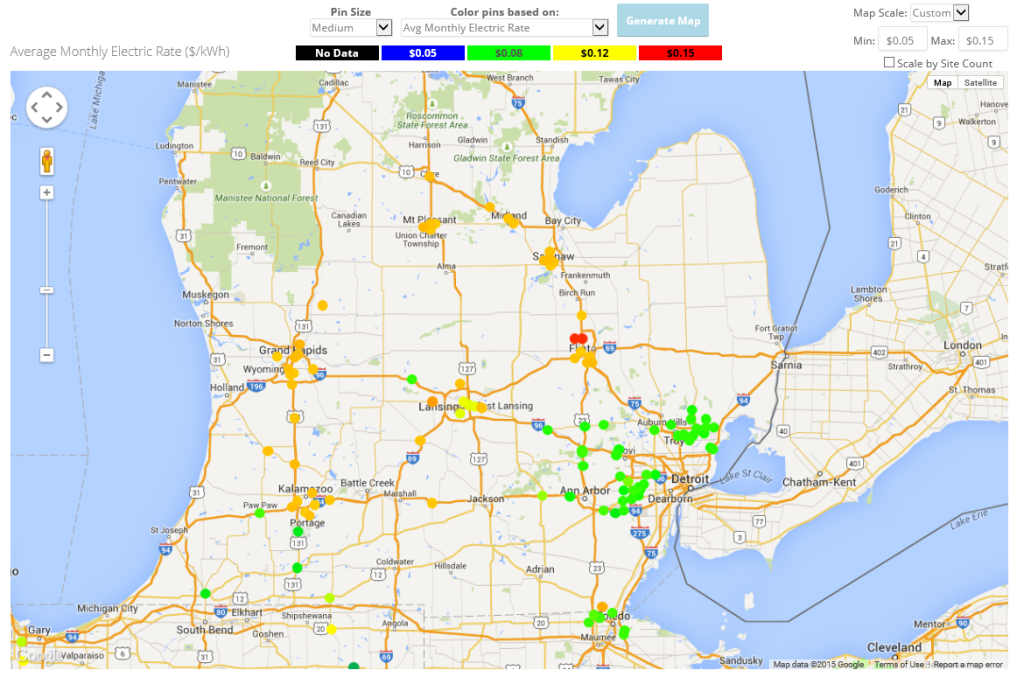
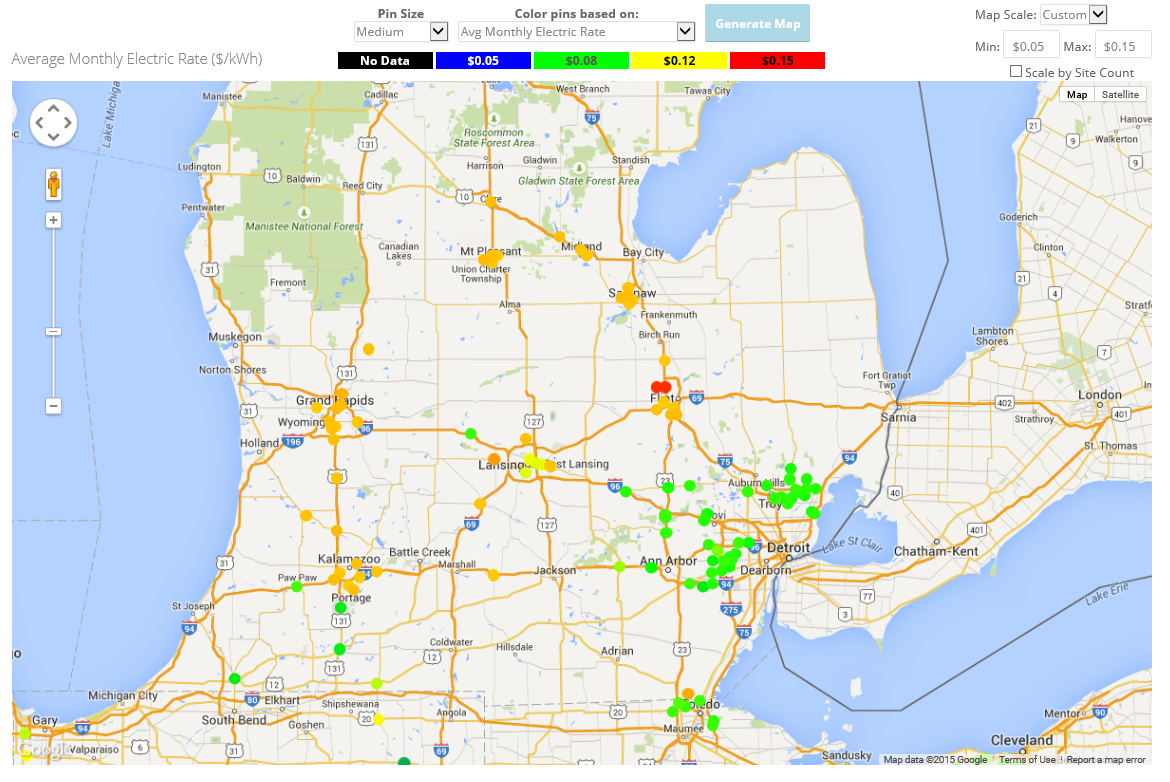
Here we can see the stark contrast between rates in the Consumers Energy and DTE service territories. We can also use this tool to spot outliers. Here is a map of average monthly electric spend:
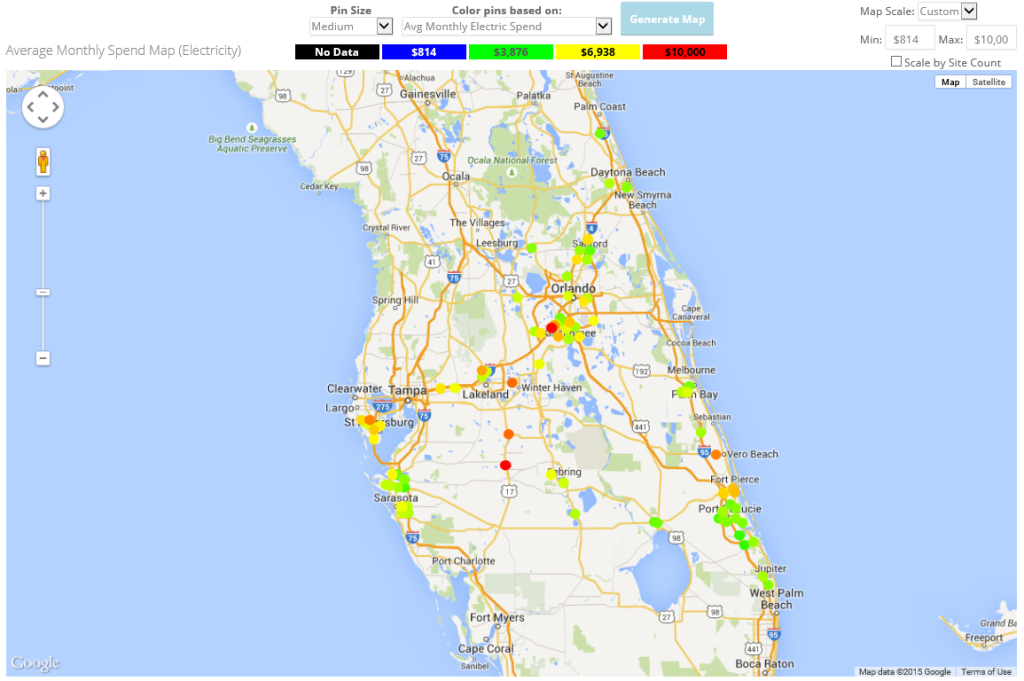
Sites that are spending significantly more than their nearby peers become immediately obvious, allowing the user to quickly identify problem sites and start the process of investigating the possible causes.
There are several other potential uses for this tool; this has just been a glimpse of some of the capabilities it contains. As with all of the tools in our Energy Strategy Platform, this is just another way that we strive to provide more of what’s meaningful and less of what’s not.
This is Part 2 of our new mini-series discussing the Burton Energy Strategy Platform! Stay tuned more posts this summer!