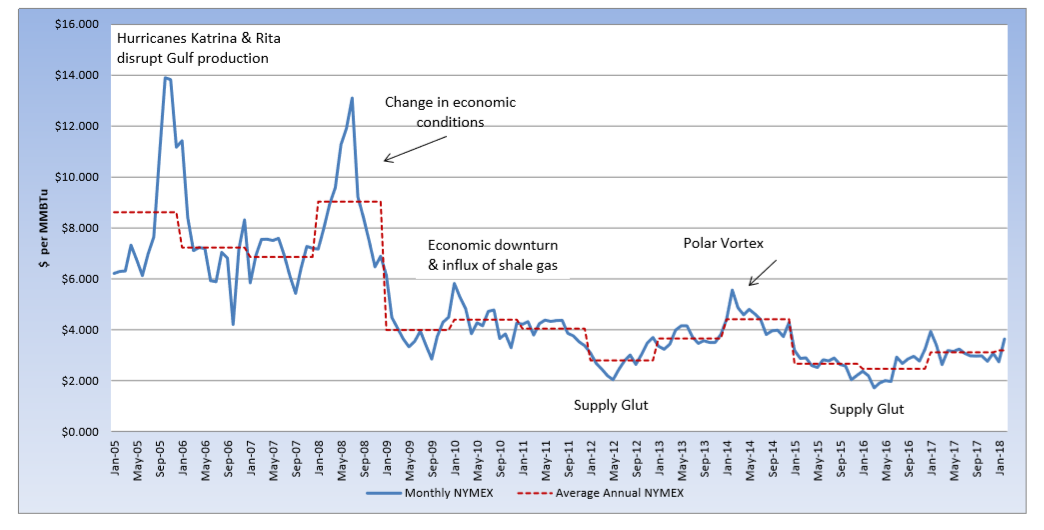
The February contract moved into the prompt position with bullish pressure and continued that momentum throughout the month. Below average temperatures across much of the U.S. drove greater demand for natural gas for heating purposes. According to The Weather Channel, a 37-month streak of daily record highs exceeding daily record lows came to an end in January, thanks to a deep dip in the jet stream, that stretched from the Rockies to the East Coast. The sustained cold temperatures pushed the February contract to as high as $3.661, before it settled at $3.631 per MMTBu for the month. The large spread between the February and March contracts, however, had technical analysts skeptical of this bullish momentum, believing it was just a correction. The March contract took its place in the prompt position nearly 13% below the February settle. Since then, it has continued to trade lower and has spent this week hovering near a six-week low at the $2.70 per MMBtu level. Weather forecasts have shifted and are predicting more normal weather for the near term and longer term, production remains high and an influx of more gas is expected due to rising oil production. As natural gas continues to trade in this narrow range, technical analysts are watching to see if traders can push this market higher, or if a decline to the $2.52 per MMBtu level seems possible.